EC 102
Lecture 2
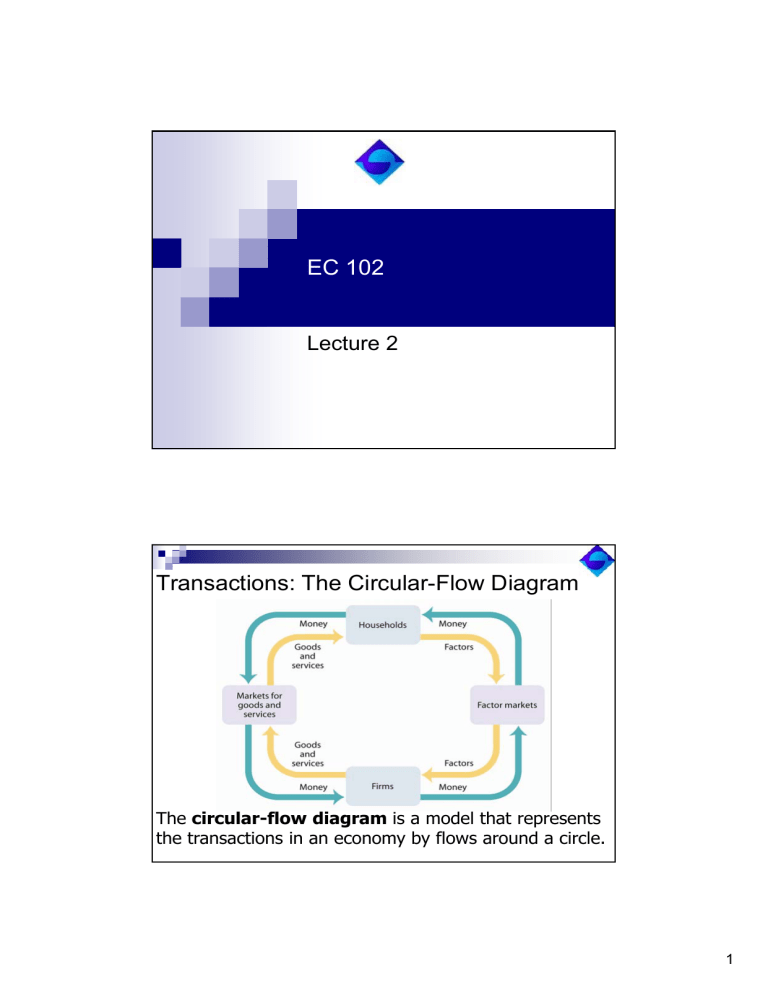
Transactions: The Circular-Flow Diagram
The circular-flow diagram is a model that represents
the transactions in an economy by flows around a circle.
1
An Expanded Circular-Flow Diagram: The Flows
of Money Through the Economy
The National Accounts
Almost all countries calculate a set of
numbers known as the national income
and product accounts.
The national income and product
accounts, or national accounts, keep
track of the flows of money between
different parts of the economy.
2
Gross Domestic Product
Gross domestic product , or GDP, measures the value of all
final goods and services produced in the economy by the factors
of production located in that country. It does not include the value
of intermediate goods.
Gross Domestic Product
Total value of final goods and services newly produced
in the country over a specified period of time
Final goods – avoid double counting
“Domestic” – within the borders of the country
Value of production = value of spending = value of
income
Production – sum up value of all final goods and
services produced in each sector
Spending – sum up value of spending by all sectors
Income – sum up compensation received by all
involved in production and services.
3
Calculation of GDP-Three
Approaches
Method 1: Total expenditure
Consumption
by households (C)
Investment expenditures by firms (I) – on
capital goods, not intermediate goods
Government expenditures (G)
Exports (X)
Imports (Z)
Y=C+I+G+X-Z
Calculating its Value – Three
Approaches
Method 2: Income Approach – adding up
production-related domestic incomes (wages,
rents, profits) earned by all individuals and
organizations
Closed vs. open economy
Need to be taken into account
- Net income from RoW : to be deducted
- Depreciation: consumption of fixed capital – to be
added
GDP = NI – Net income from RoW + Depreciation
4
Calculating its Value – Three
Approaches
Method 3: Product Approach – Rather than
looking at the final sale, utilize a “value-added”
approach
Q: how much each industry contributes the the value
of the final good or service?
Start from the raw material and see how much
market value is added at each stage
Value of sold – value of intermediate inputs used
Value added at each stage must sum up to the final
value of the final product
Input-Output tables
How do we get the figures
Use of imputation to estimate the value of some
components
Esp. Government production is imputed by summing
up the payments to workers, payments for
intermediate goods and services, allowance for
depreciation of assets
What about household production for own use? Not
counted at all!
GDP = Business production + household and
institutions production + government production
5
Calculating GDP
Gross national product , or GNP, measures the value of
all final goods and services produced in the economy by
the factors of production owned by the citizens of that
country. It does not include the value of intermediate
goods.
GNP-Net Factor Income=GDP
Net Factor Income= Turkish factors abroad-Good produced
in Turkey by foreign factors
6
Issues with GDP
Black market
Unregistered works
Not marketed services
Quality of life
Components of GDP (billions of dollars)
$15,000
Value added by government
= 12.5%
Value added by households
= 12.7%
10,000
Value added by business
= 74.9%
5,000
0
Government purchases of goods
and services
= 20.7%
Investment spending
= 12.4%
C+I+G
= $14,527
Consumer spending
= 70.5%
Value added by sector
Net exports X – IM = –$517 (–3.6%)
Spending on domestically produced
final goods and services
-5,000
7
Shares in GDP (exp. side, 1998 prices, %) (Annual, %)
Domestic Demand
Consumption
Final Consumption Exp. of Resident HH
Resident and Non-Resident Households
Non-Resident Households (-)
Resident Households in the Rest of the
Government Final Cons. Expenditure
Compensation of Employees
Purchases of Goods and Services
Gross Fixed Capital Formation
Public Sector
Machinery- Equipment
Construction
Private Sector
Machinery- Equipment
Construction
Change in Stocks
Foreign Demand
Exports of Goods and Services
Imports of Goods and Services (-)
Gross Domestic Product
2011
104.60
78.71
2012
102.04
77.37
2013
102.90
78.22
68.41
66.67
67.31
71.65
70.35
71.16
3.78
4.13
4.37
0.55
10.29
4.67
5.62
25.90
3.75
0.71
3.04
22.14
15.37
6.77
0.02
-4.62
23.89
28.51
100.00
0.46
10.70
4.73
5.96
24.67
4.05
0.99
3.06
20.62
14.00
6.62
-1.44
-0.60
27.20
27.80
100.00
0.53
10.91
4.72
6.19
24.68
4.80
0.99
3.81
19.88
13.58
6.30
0.15
-3.05
26.05
29.09
100.00
Turkey-GDP calculation
Started in 1929-not regular
1972-use of UN’s System of National
Accounts (SNA-68)
1993-new series (update back to 1987)
2008-new series (update back to 1998)
Following Eurostat’s European System of
Accounts-1995 (ESA-95).
8
TÜRKİYE İSTATİSTİK KURUMU
1998 Bazlı Güncelleme Çalışmasının
Aşamaları
A. Teknik Bilgi Kapasitesinin Artırılması
1. Teknik dökümanların elde edilmesi
2. Kurum personelinin hizmet içi eğitimi
3. Ülkelerle teknik çalışma toplantıları (Fransa,
Hollanda, Almanya, Finlandiya, Norveç ...)
4. Uluslararası danışmanlık hizmetleri (300 adam-gün,
Eurostat, Kanada, Avusturya, Hollanda...)
17
TÜRKİYE İSTATİSTİK KURUMU
1998 Bazlı Güncelleme Çalışmasının Aşamaları (devam)
B. Yeni Veri Derleme Çalışmaları
1. Sayımlar
•
•
•
•
Bina sayımı (2000)
Tarım sayımı (2001)
Sanayi ve işyeri sayımı (2002)
Nüfus sayımı (2007)
2. İş kayıtlarının kurulması ve güncellenmesi
(Gelir İdaresi Başkanlığı’ndan iş yerleri ile ilgili düzenli bilgi alınması)
3. Mevcut çalışmaların örnek hacimlerinin artırılması
•
•
•
İşgücü araştırması örnek hacmi yıllık 30,000’den 145,000’e
Bütçe araştırması (2002 yılından itibaren her yıl)
Sanayi üretim (2005 yılından itibaren 3 aylık 3500’den 6500’e)
18
9
TÜRKİYE İSTATİSTİK KURUMU
Güncelleme Çalışmasının Aşamaları(devam)
B. Yeni Veri Derleme Çalışmaları (devam)
4. Mevcut anketlerdeki değişken sayılarının artırılması
5. Yeni anketlerin yapılması (Örn. Sanayi ve hizmet istatistikleri
11 ayrı form ve yıllık örnek hacmi 120 bin)
6. Teknik katsayıların güncellenmesi 2002 AKT
•
•
•
Ticaret marjları
Ulaştırma marjları
Girdi - Çıktı oranları
C. Hesapların Dengelenmesi
1. Sektörel zaman serisinin tutarlılığının sağlanması
2. Genel dengenin sağlanması
19
TÜRKİYE İSTATİSTİK KURUMU
1987 ve 1998 Serilerinin Karşılaştırılması
A. Yöntem Değişiklikleri
1.
2.
Baz yılı değişikliği (1987 yerine 1998)
Sınıflama değişikliği,
• ISIC’dan NACE’a geçiş
• BEC sınıflamasının yanı sıra COICOP’un da
kullanılması
• Yatırım malları için SGP sınıflamasının kullanımı
3. Zincirleme endeks kullanımına geçiş (Baz yılı fiyatları
yerine önceki yılın ortalama fiyatlarını kullanma)
4. Sektörel katma değerin hesaplanmasında üretici fiyatları
yerine temel fiyatların kullanılması
20
10
TÜRKİYE İSTATİSTİK KURUMU
1987 ve 1998 Serilerinin Karşılaştırılması (devam)
A. Yöntem Değişiklikleri (devam)
5. İşgücü girdi yaklaşımı (imalat, madencilik, inşaat ve hizmet sektörleri)
Her bir sektörde HİA sonuçlarına göre elde edilen çalışan sayıları
ile sektörden gelen çalışan sayıları arasındaki fark kadar, ilgili
sektördeki 1-9 kişi çalışanı olan işyerilerinin çalışan başına
ortalama katma değerin sektöre eklenmesi. (Örn. imalat sanayinde
2002 yılında işyeri bazlı anketlerde çalışan sayısı 2,133,000 iken,
HİA sonuçlarına göre bu sayı 3,545,000 kişidir)
6. İnşaat sektöründe mal akım yöntemi ile eksik kapsamın giderilmesi
7. Mali aracılık hizmetlerinde FISIM hesabı
8. Konut sektöründe oluşan katma değerin hesaplanmasında önemli
farklılaşma olmuştur. (örn. 2006 yılı için eski seride 15,2 milyon olan
konut sayısı 1998 bazlı seride 23,5 milyondur. Ortalama kira bedeli
ise 1987 bazlı seride 163 YTL iken yeni seride 299 YTLdir. Katma
değer artış oranı % 170,7 dir.)
21
TÜRKİYE İSTATİSTİK KURUMU
1987 ve 1998 Serilerinin Karşılaştırılması (devam)
A. Yöntem Değişiklikleri (devam)
9. Cari değerlerden sabit değerlere geçişte yöntem değişiklliği (Örn. Mali
aracılık sektöründe çalışan sayısı yerine TÜFE kullanılmaktadır)
10. Sabit girdi-çıktı katsayıları yerine değişken katsayıların kullanılması
11. Dolaylı yöntemler kullanmak yerine, doğrudan alandan elde edilen
verilerin kullanılması (Örn. gayri menkul kiralama ve iş faaliyetleri,
eğitim, sağlık, diğer toplumsal ve kişisel hizmet faaliyetleri)
12. Dış ticaret verilerinde özel ticaret sisteminden genel ticaret sistemine
geçiş (serbest bölgelerde yapılan ticaretin dış ticarete dahil
edilmesiyle 2006 yılı için yıllık dış ticaret açığı yaklaşık 1 milyar $
azalmıştır.)
13. 1987 bazlı TEFE ve TÜFE yerine, 2003 bazlı ÜFE ve TÜFE
kullanılması
14. Eski seride devlet sektöründe yer alan eğitim, sağlık, diğer toplumsal
hizmetlerin ilgili sektörlerine aktarılması
22
11
TÜRKİYE İSTATİSTİK KURUMU
1987 ve 1998 Serilerinin Karşılaştırılması (devam)
B. Kapsam Genişlemesi
1. 2000 Bina Sayımı. (Eski seride 2000 yılı için 13.9 milyon olan konut
sayısı, yeni seride 19.2 milyona çıkmıştır, fark 5.3 milyon)
2. 2001 Tarım Sayımı. (Tarımsal üretimin hesaplamasında kullanılan teknik
katsayıların güncellenmesi; etkisi az da olsa yeni ürünlerin
eklenmesi)
3. 2002 Sanayi ve İşyerleri Sayımı. (Eski seride 2001 yılı için 10 ve daha
fazla kişi çalıştıran işyeri sayısı 11 293 iken bu sayı 2002 yılında 27
813’e yükselmiştir.)
4. Yeni sektörlerin kapsama alınması (internet hizmet sağlayıcıları,
kiralama şirketleri, faktöring, katılım bankaları, kar amacı olmayan
mali aracı kuruluşlar, vb)
5. Hanelerde kayıtdışı yevmiyeli hizmet sunan (temizlik, çocuk bakımı,
bahçıvanlık, vb.) kişilerin üretimlerinin hesaplara dahil edilmesi. 2006
yılı için bu miktar 1.2 milyar YTL’dir
23
Nominal GDP-Turkey (million
TL)
Nominal
2000
166 658
2005
648 931
289%
2010
1 098 799
69%
2013
1 565 181
42%
12
Growth, Price Changes and Real
GDP
Nominal vs. Real GDP
Nominal GDP – total production valued at current
prices (current meaning the year in consideration)
!! Not only the level of output but also the price levels
change from one year to another.
Real GDP – Actual value of goods and services
produced which is net of price changes
GDP = Σ (P x Q)
Real vs. Nominal GDP
Real GDP: the value of the final goods and services produced
calculated using the prices of some base year.
Nominal GDP: output valued at current prices.
Real GDP per capita is a measure of average output per
person, but is not by itself an appropriate policy goal.
13
Growth, Price Changes and Real
GDP
Calculate Real GDP using constant prices from a base
year/reference year
For the base year Nominal and Real GDP are same!
Calculating GDP and Real GDP in a
Simple Economy
14
Real vs. Nominal GDP
Real vs nominal GDP-Turkey
(million TL)
Real
Nominal
2000
72 436
2005
90 499
25%
648 931
289%
2010
105 885
17%
1 098 799
69%
2013
122 388
16%
1 565 181
42%
166 658
15
Growth, Price Changes and Real
GDP
GDP Growth – changes in GDP over time, percentage
change in the value of GDP from one year to another.
Percentage change = [(Value2-Value1)/Value1]*100
Annual growth and quarterly growth
GDP and IPI Growth
16
GDP and per capita GDP Growth
Growth, Price Changes and Real
GDP
Use of price indices – to measure the changes in
prices as compared to another period.
Example: CPI (TÜFE) – consumer price index:
measuring changes in prices of goods and
services bought by households.
Weighted average of a bundle of goods and
services
17
Price Indexes and the Aggregate
Price Level
A price index is the ratio of the current cost of that market
basket to the cost in a base year, multiplied by 100. It allows to
track the change in price of a weighted average of many goods
Calculating the Cost of a Market
Basket
18
The Makeup of the Consumer Price
Index in 2010
TURKEY
FOOD AND NON-ALCOHOLIC BEVERAGES
100.00
28.63
ALCOHOLIC BEVERAGES AND TOBACCO
5.00
CLOTHING AND FOOTWEAR
8.07
HOUSING, WATER, ELECTRICITY, GAS AND OTHER FUELS
16.60
FURNISHINGS, HOUSEHOLD EQUIPMENT, ROUTINE MAINTENANCE OF THE HOUSE
7.42
HEALTH
2.54
TRANSPORT
12.59
COMMUNICATIONS
4.30
RECREATION AND CULTURE
2.81
EDUCATION
2.24
HOTELS, CAFES AND RESTAURANTS
5.64
MISCELLANEOUS GOODS AND SERVICES
4.16
19
20
Growth, Price Changes and Real
GDP
Other indices are used: e.g. PPI – using prices
facing domestic producers
Baskets are different, inflation rates differ!
GDP Deflator – implicit price deflator
GDP Deflator = (Nominal GDP / Real GDP) *100
Reflects changes in all the prices of goods and
services included in GDP.
21
The CPI, the PPI, and the GDP
Deflator
Biases in price indices
Bias = A consistent form of error (i.e. being usually too
high)
New Product Bias: CPI ignores new products until they
become cheap enough to be popular
Causes CPI to overestimate inflation
Quality Improvement Bias: If the price of a product goes
up because it's better, then it's no inflation
Causes CPI to overestimate inflation
Substitution Bias: People switch between substitutes in
response to high or low prices
Causes CPI to overestimate inflation
22
Unemployment
Employment: total number of people currently employed
in the economy
Unemployment: number of people who are actively
looking for work but aren’t currently employed
Labor force: sum of employment and unemployment
Unemployment rate:
Unemployment/(Unemployment+Employment)
23
Shortcomings of unemployment
rate
Discouraged workers: nonworking people
who are capable of working but have given
up looking for a job
Labor force participation
24
Website links
•
•
•
•
•
•
•
•
•
•
•
Website of the Commission on the Measurement of Economic Performance and Social Progress
http://www.stiglitz‐sen‐fitoussi.fr/en/index.htm
Enflasyonmetre by Asaf Savaş Akat:
http://akat.bilgi.edu.tr/pages_beno2.asp#top
TUIK (Turkish Statistics Institute): tuik.gov.tr
Central Bank website for data:
http://evds.tcmb.gov.tr/cbt.html
25

