Vitamin D Dependent Down Regulation of Arf1
advertisement
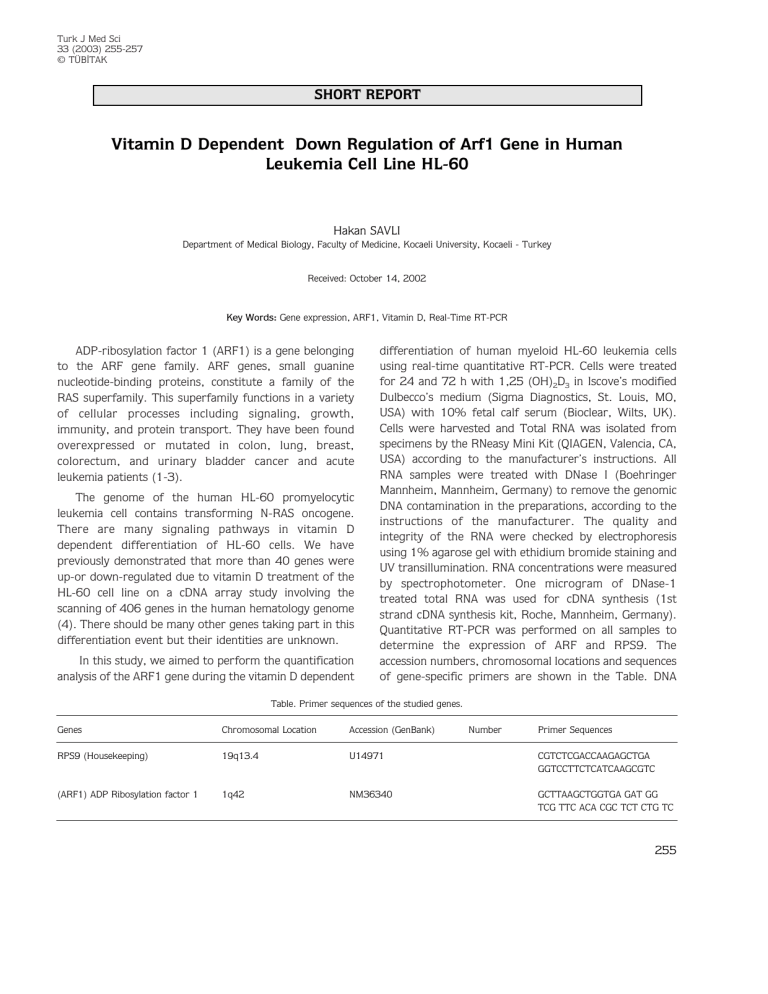
Turk J Med Sci 33 (2003) 255-257 © TÜB‹TAK SHORT REPORT Vitamin D Dependent Down Regulation of Arf1 Gene in Human Leukemia Cell Line HL-60 Hakan SAVLI Department of Medical Biology, Faculty of Medicine, Kocaeli University, Kocaeli - Turkey Received: October 14, 2002 Key Words: Gene expression, ARF1, Vitamin D, Real-Time RT-PCR ADP-ribosylation factor 1 (ARF1) is a gene belonging to the ARF gene family. ARF genes, small guanine nucleotide-binding proteins, constitute a family of the RAS superfamily. This superfamily functions in a variety of cellular processes including signaling, growth, immunity, and protein transport. They have been found overexpressed or mutated in colon, lung, breast, colorectum, and urinary bladder cancer and acute leukemia patients (1-3). The genome of the human HL-60 promyelocytic leukemia cell contains transforming N-RAS oncogene. There are many signaling pathways in vitamin D dependent differentiation of HL-60 cells. We have previously demonstrated that more than 40 genes were up-or down-regulated due to vitamin D treatment of the HL-60 cell line on a cDNA array study involving the scanning of 406 genes in the human hematology genome (4). There should be many other genes taking part in this differentiation event but their identities are unknown. In this study, we aimed to perform the quantification analysis of the ARF1 gene during the vitamin D dependent differentiation of human myeloid HL-60 leukemia cells using real-time quantitative RT-PCR. Cells were treated for 24 and 72 h with 1,25 (OH)2D3 in Iscove’s modified Dulbecco’s medium (Sigma Diagnostics, St. Louis, MO, USA) with 10% fetal calf serum (Bioclear, Wilts, UK). Cells were harvested and Total RNA was isolated from specimens by the RNeasy Mini Kit (QIAGEN, Valencia, CA, USA) according to the manufacturer’s instructions. All RNA samples were treated with DNase I (Boehringer Mannheim, Mannheim, Germany) to remove the genomic DNA contamination in the preparations, according to the instructions of the manufacturer. The quality and integrity of the RNA were checked by electrophoresis using 1% agarose gel with ethidium bromide staining and UV transillumination. RNA concentrations were measured by spectrophotometer. One microgram of DNase-1 treated total RNA was used for cDNA synthesis (1st strand cDNA synthesis kit, Roche, Mannheim, Germany). Quantitative RT-PCR was performed on all samples to determine the expression of ARF and RPS9. The accession numbers, chromosomal locations and sequences of gene-specific primers are shown in the Table. DNA Table. Primer sequences of the studied genes. Genes Chromosomal Location Accession (GenBank) Number Primer Sequences RPS9 (Housekeeping) 19q13.4 U14971 CGTCTCGACCAAGAGCTGA GGTCCTTCTCATCAAGCGTC (ARF1) ADP Ribosylation factor 1 1q42 NM36340 GCTTAAGCTGGTGA GAT GG TCG TTC ACA CGC TCT CTG TC 255 Vitamin D Dependent Down Regulation of Arf1 Gene in Human Leukemia Cell Line HL-60 The gene expression ratios in 24 and 72 h treated samples were compared to non-treated samples. ARF1 levels were down-regulated 28-fold at 24 h and 164-fold at 72 h after 1,25(OH)2D3 treatment. Gene specific amplifications of ARF1 and housekeeping RPS9 genes were demonstrated with melting curves (Figure 1). Previous studies showed that HL60 cells are induced to differentiate with vitamin D through different signaling pathways as an MEK—ERK (5) module and RAS-RAFMAP kinase cascade (6). This study is the first attempt to analyze the ARF1 gene during vitamin D treatment. Here we also proposed the first optimized strategy for quantifying the ARF1 gene by real-time (kinetic) RT-PCR. Further studies may help us to understand the exact role of this gene in differentiation and the cell cycle. 65.0 66.0 68.0 70.0 72.0 74.0 76.0 78.0 80.0 82.0 84.0 86.0 88.0 90.0 92.0 — — — — — — — — — — — — — — — a — Fluorescence (F1) 14.0 — 13.0 — 12.0 — 11.0 — 10.0 — 9.0 — 8.0 — 7.0 — 6.0 — 5.0 — 4.0 — 3.0 — 2.0 — 1.0 — 0.0 — -1.0 — 94.0 96.0 Temperature (°C) — 78.0 80.0 82.0 84.0 86.0 88.0 90.0 — — 76.0 — — 74.0 — — 72.0 — — 70.0 — — 67.0 68.0 — — b — 3.0 — 2.8 — 2.6 — 2.4 — 2.2 — 2.0 — 1.8 — 1.4 — — 1.2 — 1.0 — 0.8 — 0.6 — 0.4 — 0.2 — 0.0 — -0.2 — -0.4 — Fluorescence -d(F1)/dT Master SYBR Green 1 mix (Roche) was used with 2 µl of cDNA and with 10 pmol of the primers. PCR was performed on a LightCycler, a rapid thermal cycling instrument (Roche Diagnostics GmbH, Germany) in capillary glass tubes. The amplification program consisted of 1 cycle of 95 ºC with a 60-s hold, followed by 45 cycles of 95 ºC with a 10-s hold, an annealing temperature at 55 ºC with a 5-s hold, and 72 ºC with a 20-s hold. Amplification was followed by melting curve analysis using the program run for one cycle at 95 ºC with a 0-s hold, 65 ºC with a 10-s hold, and 95 ºC with a 0-s hold at the step acquisition mode. A negative control without the cDNA template was run with every assay to assess the overall specificity. Each assay included duplicate reactions for each dilution and was repeated. Standard curves were obtained using serial dilutions of the beta-globulin gene (DNA Control kit, Roche) according to the supplier’s instructions. The concentration of each gene was determined on the basis of the kinetic approach using the LightCycler software. The levels of the housekeeping gene RPS9 were used as an internal control for the normalization of RNA quantity and quality differences in all samples. Ratios were calculated using the following formula. Ratio: observed gene expressions in 1,25(OH)2D3 treated HL 60 cells / observed gene expressions in non-treated HL-60 cells. 92.093 .0 Temperature (°C) Specific amplifications of ARF1 and RPS9 genes in 1,25(OH)2D3 treated HL 60 cells Figure 1. (a) Melting curve analysis demonstrating the gradual reduction in fluorecence as temperature increases. The decreases at 83 ºC for ARF1 and 85.5 ºC for RPS9 indicate the specific products that melt at this temperature. (b) The specific melting temperatures of the products can be visualized more clearly as a peak in the first derivative plot. Corresponding author: Hakan SAVLI ODTU Sitesi, 327 Sokak. No 27, Karakusunlar, Balgat, Ankara - Turkey E-mail: [email protected] References 1. 256 Ryberg D, Tefre T, Ovrebo S, et al. Haras-1 alleles in Norwegian lung cancer patients. Hum Genet 86: 40-44, 1990. 2. Fujita J, Srivastava SK, Kraus M , et al. Frequency of molecular alterations affecting ras protooncogenes in human urinary tract tumors. Proc Nat Acad Sci 82: 3849-3853, 1985. 3. Krontiris TG, Devlin B, Karp DD, et al. An association between the risk of cancer and mutations in the HRAS1 minisatellite locus. New Eng J Med 329: 517-523, 1993. H. SAVLI 4. Savli H, Aalto Y, Nagy B, et al. Gene expression analysis of 1,25(OH)2D3 dependent differentiation of HL-60 cells a cDNA array study. British Journal of Haematology 118: 1065-1070, 2002. 5. Wang X, Studzinski GP. Phosphorylation of raf-1 by kinase suppressor of ras is inhibited by “MEKspecific” inhibitors PD 098059 and U0126 in differentiating HL60 cells. Exp Cell Res 268: 294-300, 2001. 6. Solomon C, White J.H., Rhim JS, et al. Vitamin D Resistance in RASTransformed Keratinocytes: Mechanism and Reversal Strategies. Radiation Research 155: 156–162, 2001. 257
